Improving Web Accessibility With Figma Wireframes
in Web Dev
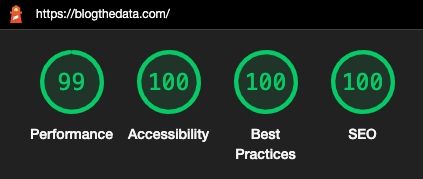
The journey began when I ran my first Google Lighthouse test and scored 86% for A11Y (Accessibility). From there, I added alt text to all my images and increased the contrast in several areas. This brought my score to 100, but I would hardly call my site accessible at that point.
I recently read through WCAG 2.1. Okay, I didn't read it cover-to-cover but combined with a few Youtube videos and several additional automated tools recommended by W3, I found more ways to increase accessibility.
The primary issue with my site was that I was not correctly implementing semantic HTML. Turns out elements like < h1 > and < h2 > don't just change font-size; They provide meaningful structure to the page, allowing search crawlers, power users, and the visually impaired to navigate a site.
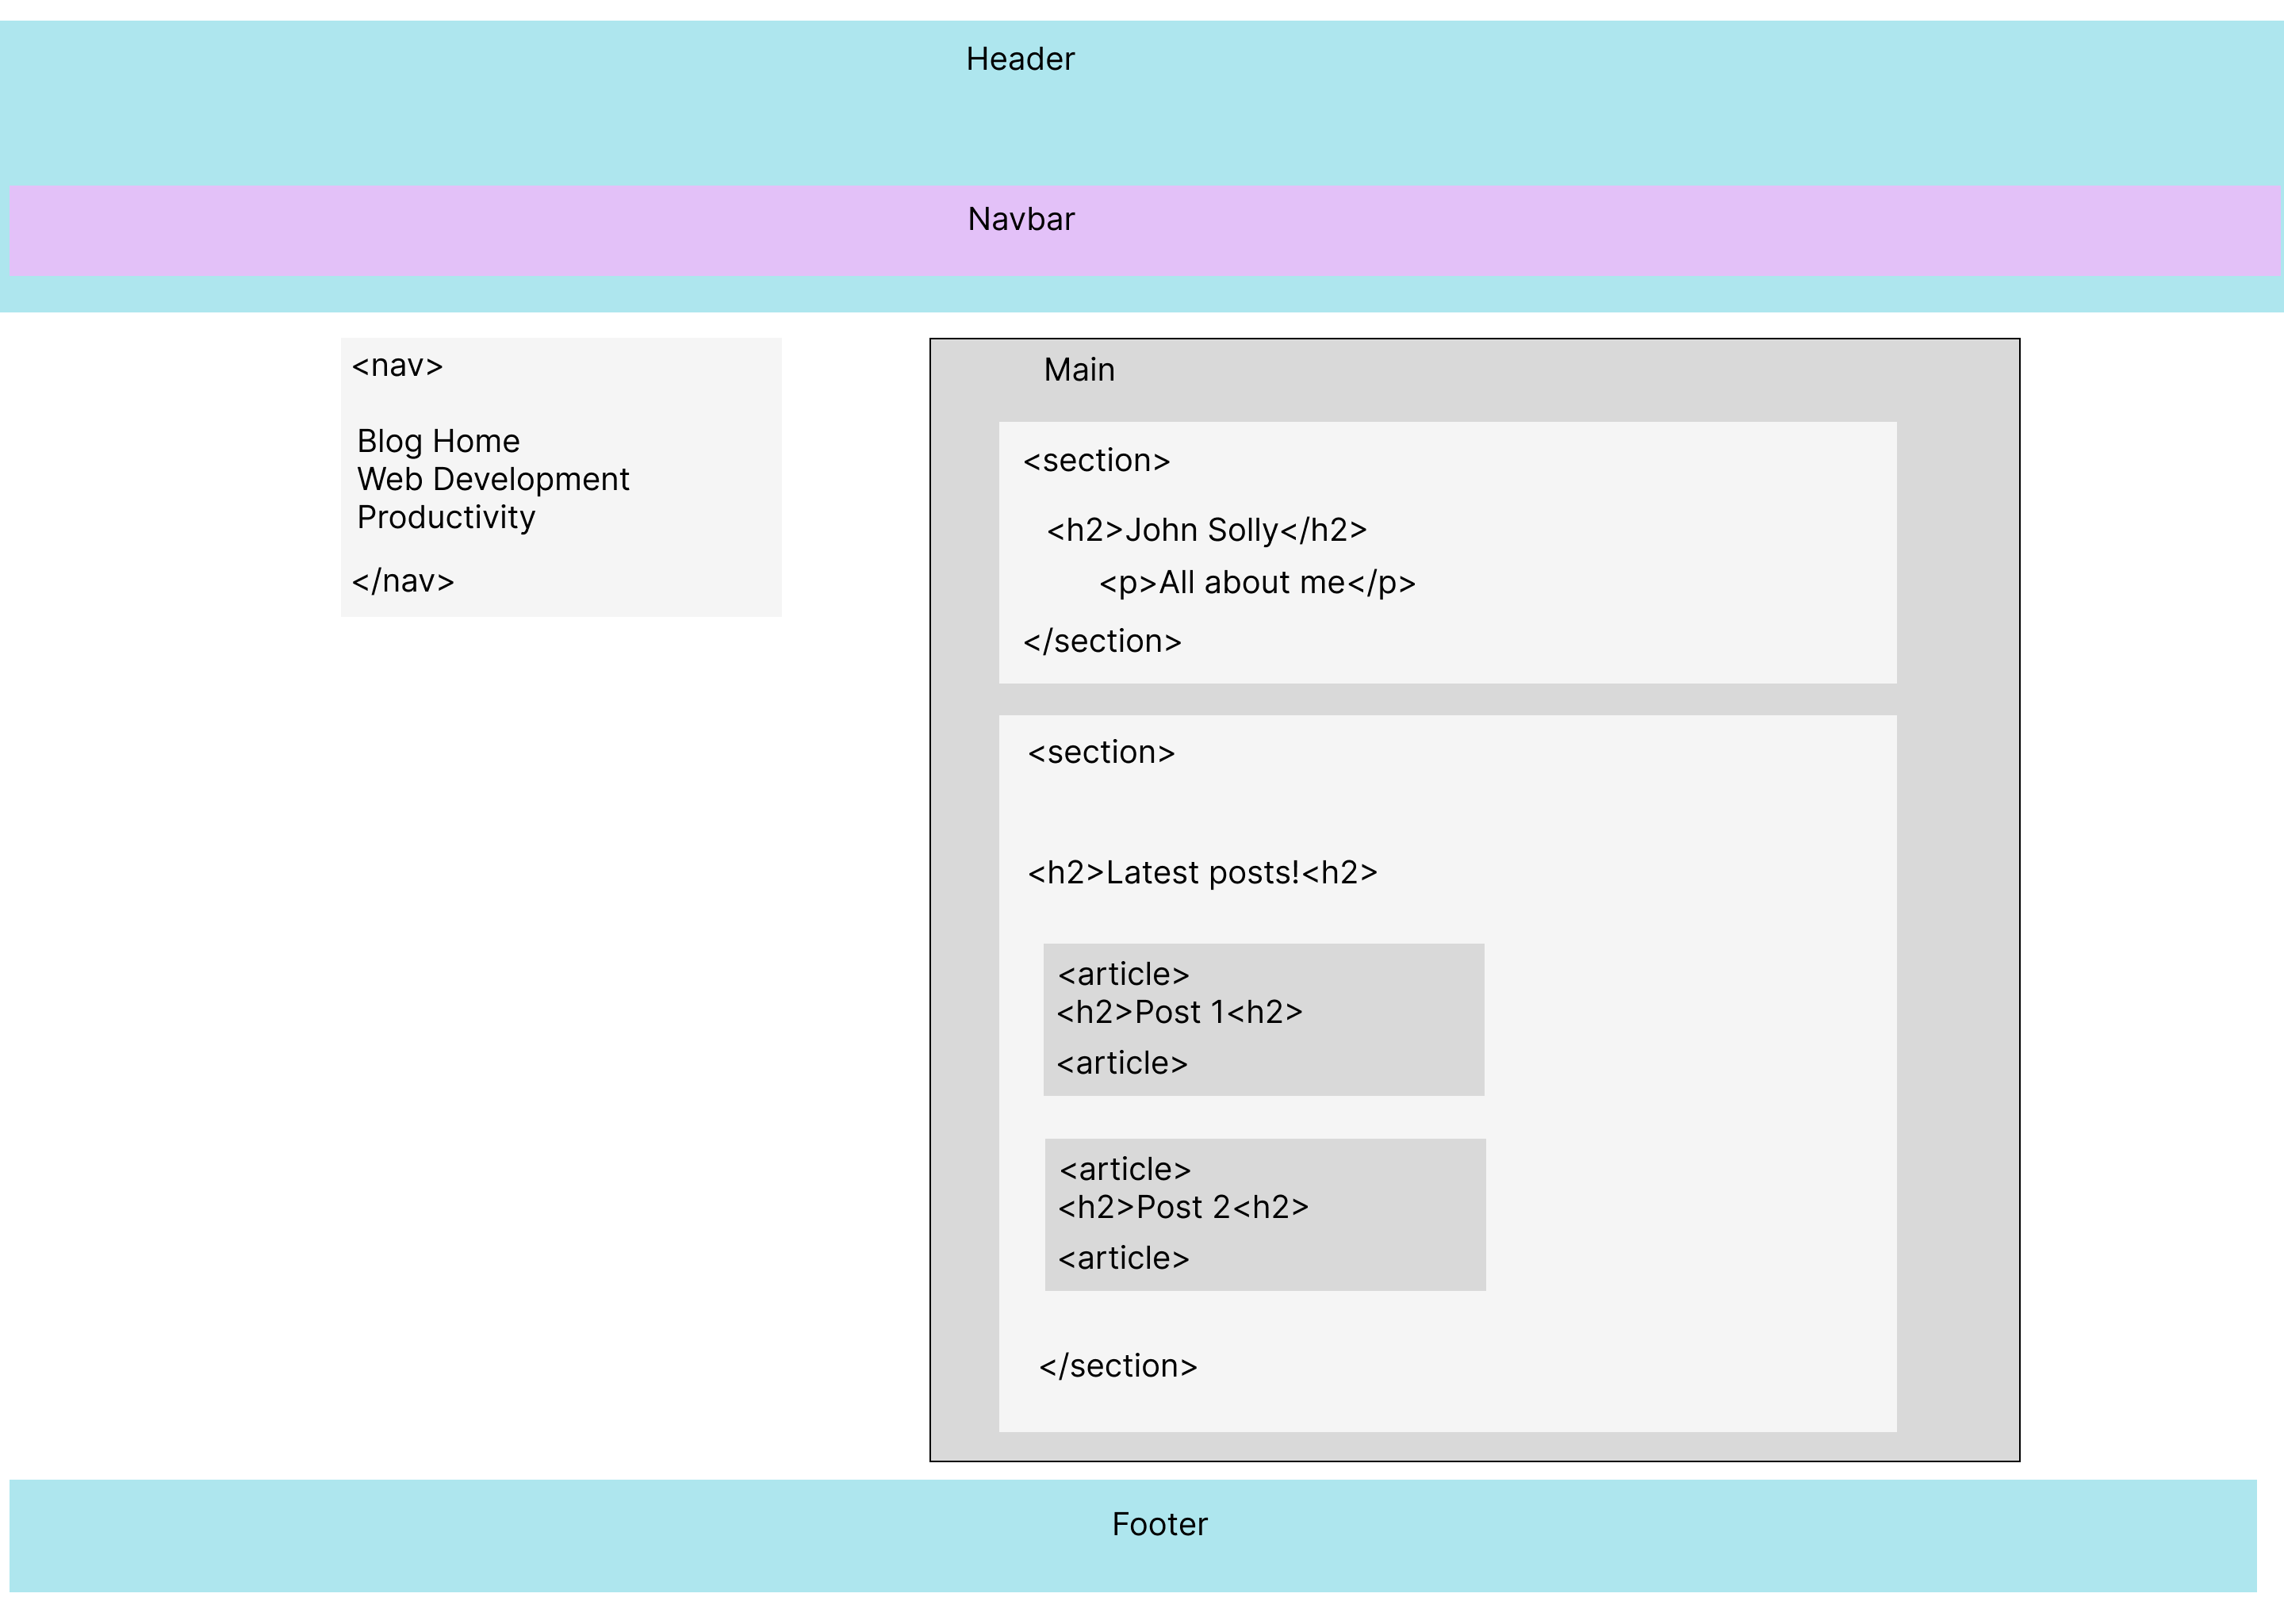
After creating a wireframe of my site in Figma, I added landmark elements, ensured my headings followed a sequential order, and added a few nice-to-haves like a skip link to allow keyboard users to skip over the nav right into the main content of the page.
Figma wireframe of blogthedata.com's homepage
Although never finished, I think I've made great strides toward a more accessible website!


Related Posts
Optimizing Your Website's Performance With a Google Lighthouse Audit
 2 min read
Improve website performance with Google Lighthouse Audit. Learn how to increase mobile and desktop scores for Performance, A11Y, Best Practices, and SEO.
0
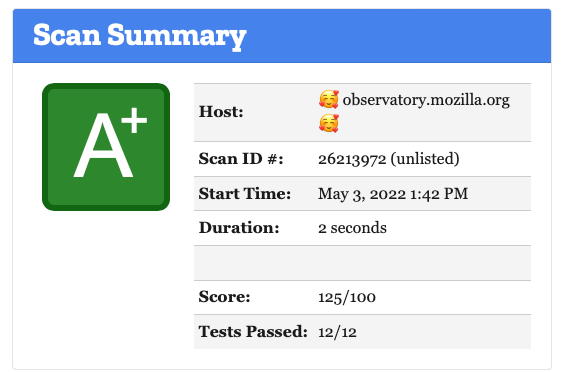
How I Improved My Security Score With Mozilla Observatory: A Guide
13 min read
Discover how to improve your rating using Mozilla Observatory's security assessment tool. See the steps I took to upgrade my score from a 'F' to an 'A+'.
0
Optimize Render Blocking Resources With Template Blocks in Django
3 min read
Learn how to optimize your website's page load speed with template blocks and a Google Lighthouse audit. Discover how to remove unnecessary CSS and JavaScript.
0

John Solly
Hi, I'm John, a Software Engineer with a decade of experience building, deploying, and maintaining cloud-native geospatial solutions. I currently serve as a senior software engineer at New Light Technologies (NLT), where I work on a variety of infrastructure and application development projects.
Throughout my career, I've built applications on platforms like Esri and Mapbox while also leveraging open-source GIS technologies such as OpenLayers, GeoServer, and GDAL. This blog is where I share useful articles with the GeoDev community. Check out my portfolio to see my latest work!
Comments