Creating Interactive Maps With Leaflet.js: A Step-by-Step Guide
in Geo Dev
Leaflet.js is an open-source JavaScript library for interactive maps. After copying a couple lines of code into your application, you have full access to the library. I’ve added two plugins, Leaflet.Arc for drawing great circle polylines and Leaflet.TextPath for displaying text labels above the polylines.
// site_analytics.html
{% block head %}
<!-- Leaflet -->
<link rel="stylesheet" href="https://unpkg.com/[email protected]/dist/leaflet.css"
  integrity="sha512-hoalWLoI8r4UszCkZ5kL8vayOGVae1oxXe/2A4AO6J9+580uKHDO3JdHb7NzwwzK5xr/Fs0W40kiNHxM9vyTtQ=="
  crossorigin="" />
<script src="https://unpkg.com/[email protected]/dist/leaflet.js"
  integrity="sha512-BB3hKbKWOc9Ez/TAwyWxNXeoV9c1v6FIeYiBieIWkpLjauysF18NzgR1MBNBXf8/KABdlkX68nAhlwcDFLGPCQ=="
  crossorigin=""></script>
<!-- Leaflet Plugins -->
{% sri_static 'leaflet_plugins/leaflet.textpath.js' %}
{% sri_static 'leaflet_plugins/leaflet-arc.min.js' %}
{% endblock head %}
I place leaflet.js code in a separate file and inject it into the template underneath a <div> tag.
// site_analytics.html
<div id="map"></div>
{% sri_static 'maps/leaflet_server_map.js' %}
In main.css, I set the map width to 100% of the container and the height to 40% of the viewport.
// main.css
#map{
  height: 40vh;
  width : 100%;
}
First, I add a map
// leaflet_map.js
var map = L.map('map', {
    center: [39, -98],
    zoom: 4,
});
Then, a scalebar
L.control.scale({ imperial: true, metric: true }).addTo(map); A basemap
L.tileLayer('https://{s}.tile.openstreetmap.org/{z}/{x}/{y}.png', {
maxZoom: 20,
attribution: '© <a href="https://openstreetmap.org/copyright">OpenStreetMap contributors</a>'
}).addTo(map);Now we have a map centered at the geographic center of the US. Next, I add three markers for the cities of Los Angeles, Dallas, and NYC.
var LaLatLng = { lat: 34.1, lon: -118.2 }
var DallasLatLng = { lat: 32.8, lon: -96.8 }
var NYCLatLng = { lat: 40.7, lon: -73.9 }
For each marker, I include a title and alt text. I wanted to use a custom marker icon for the Dallas marker, so I found one on Flaticon. After adding the icon png to /static, I reference it from within the JavaScript file.
var IPAddressIcon = L.icon({
iconUrl: "static/icons/ip-address.png",
iconSize: [40, 40]
});
var DallasMarkerOptions = {
title: "Blogthedata.com Server",
alt: "The city of Dallas, Texas. USA",
icon: IPAddressIcon
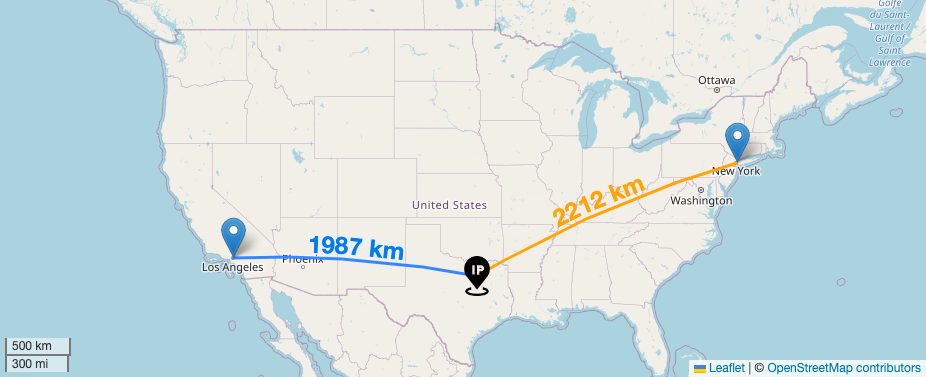
}After adding the markers, I add polylines connecting the markers. The Polyline.Arc syntax is leveraging the Leaflet.Arc plugin to draw a great circle route. A plane would take this path when traveling between these locations.
var DallasToNYC = L.Polyline.Arc([DallasLatLng.lat, DallasLatLng.lon], [NYCLatLng.lat, NYCLatLng.lon], { color: 'orange' })Next, I want to show the distance between the two cities. I could have hard-coded this, but it was easy enough to do it in the client since I am only performing a couple calculations.
var DallasToNYCDistance = (Math.floor(map.distance(DallasLatLng, NYCLatLng) / 1000)).toString()With the distance as a string, I add it to the polyline and then add the polyline to the map.
DallasToNYC.setText(DallasToNYCDistance.concat(' km'), {
    center: true,
    offset: -5,
    attributes: { 'font-size': '24', 'font-weight': 'bold', fill: 'orange' }
})
DallasToNYC.addTo(map)
And we've got a map!
Comments
- No comments yet.


Related Posts

Improving Security With SRI: From F to B on Mozilla Observatory
 4 min read
Learn how to implement SRI and improve security, including how to generate cryptographic hashes and use the django-sri module | A Step-by-step guide

Demystifying the CKEditor 4 to 5 Migration Process: Lessons Learned
6 min readLearn how to migrate from CKEditor 4 to CKEditor 5 and strengthen your Content Security Policy (CSP) by removing unsafe-inline scripts | A Guide
0
Optimize Render Blocking Resources With Template Blocks in Django
3 min readLearn how to optimize your website's page load speed with template blocks and a Google Lighthouse audit. Discover how to remove unnecessary CSS and JavaScript.
0

John Solly
Hi, I'm John, a Software Engineer with a decade of experience building, deploying, and maintaining cloud-native geospatial solutions. I currently serve as a senior software engineer at HazardHub (A Guidewire Offering), where I work on a variety of infrastructure and application development projects.
Throughout my career, I've built applications on platforms like Esri and Mapbox while also leveraging open-source GIS technologies such as OpenLayers, GeoServer, and GDAL. This blog is where I share useful articles with the GeoDev community. Check out my portfolio to see my latest work!
0